Asscher Cut Proportions: Ratio, Depth, Table & Visual Quality
How to use measurements without mistaking a spreadsheet for cut quality
Quick answer
For an Asscher, start with a square outline and sensible depth/table numbers, but do not buy from proportions alone. GIA does not currently assign an overall cut grade to fancy shapes such as square emerald/Asscher-style diamonds, so the report helps you screen candidates rather than certify visual performance.
Key takeaways
- A near-square 1.00–1.05 length-to-width ratio is the most traditional Asscher look.
- Depth and table are useful filters, not pass/fail rules.
- Check the actual millimeter measurements because carat weight can be hidden in depth.
- High-resolution video matters for contrast, windowing and the windmill pattern.
- Avoid any seller claim that a single proportion set is an official “GIA Ideal Asscher” standard.
Length-to-width ratio: keep the outline square
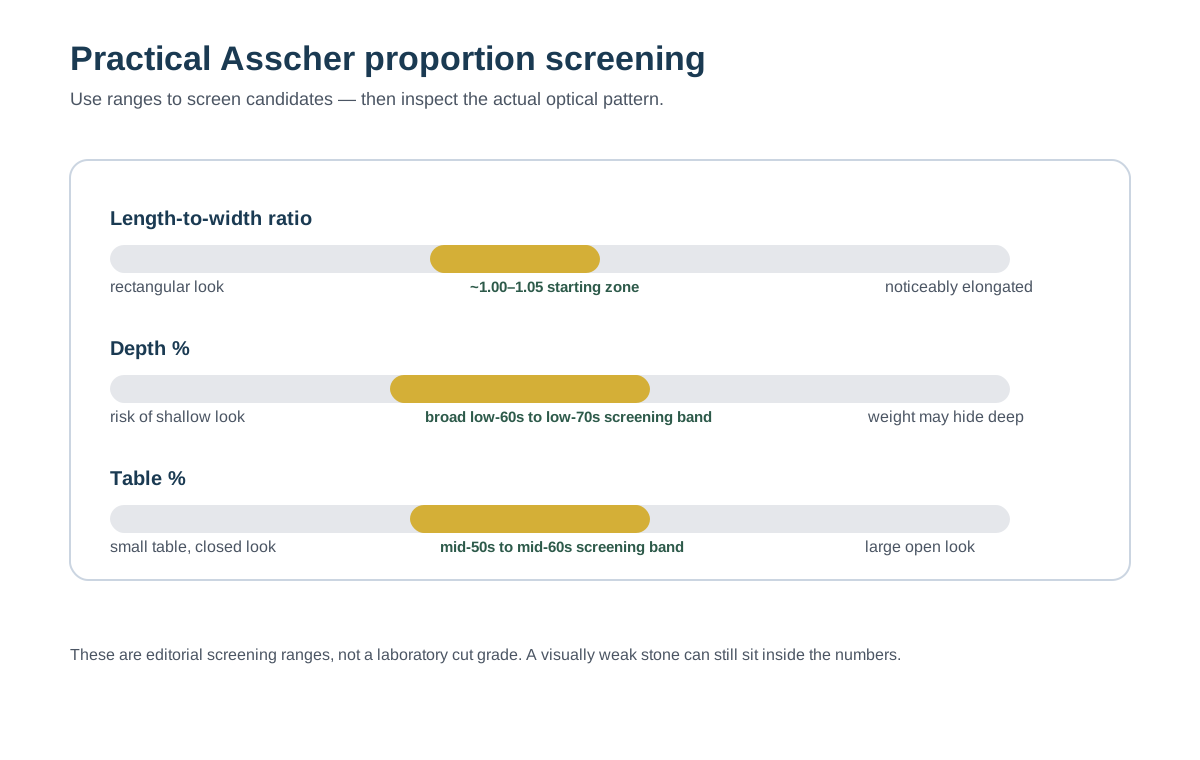
Length-to-width ratio is calculated by dividing the longer face-up measurement by the shorter. A perfectly square outline is 1.00. For buyers who want the classic Asscher silhouette, roughly 1.00–1.05 is a useful screening zone. Moving above that can create a visibly rectangular stone, which may be attractive but starts to overlap aesthetically with short emerald cuts.
Do not reject a stone because it is 1.06 if the outline looks balanced to you. Ratio is a description of shape, not a light-performance grade.
Depth percentage: where carat weight can hide
Asschers are naturally deeper than many brilliant cuts because their step-facet architecture and clipped corners require vertical structure. A practical comparison often begins around the low 60s through low 70s, but there is no universal depth number that guarantees beauty.
The buying implication is simple: compare millimeter spread along with carat weight. Two 1.00 ct Asschers can face up at noticeably different sizes if one carries more weight below the girdle.
Table percentage: balance openness and pattern
The table is the large top facet. Many attractive Asschers fall somewhere around the mid-50s through mid-60s percentage range, but again, that is a screening band rather than an official quality grade. Very large tables can make the center look open or glassy; very small tables can alter contrast and visual character.
Use the number to narrow a list, then judge the actual pattern.
Proportions work as a system
A diamond is a three-dimensional optical object. Ratio, depth, table, crown, pavilion, girdle, facet alignment, polish and symmetry interact. That is why a stone with “preferred” headline numbers can still look weak, while a stone just outside a popular range can look excellent.
For Asschers, the report is the map; the face-up image is the terrain.
What to inspect in video
- A centered, coherent windmill or concentric-square pattern.
- Balanced contrast that changes as the stone rotates.
- No large persistent see-through window under the table.
- No broad dead zones that stay black through normal movement.
- Symmetry of the clipped corners and step pattern.
A practical screening framework
| Signal | Useful starting point | Do not assume | Final check |
|---|---|---|---|
| L/W ratio | About 1.00–1.05 | 1.06 is automatically poor | Does the outline look square enough for you? |
| Depth | Often low-60s to low-70s | Deeper always means bad | Compare millimeter spread with similar-carat stones |
| Table | Often mid-50s to mid-60s | One table percentage guarantees beauty | Check center openness and facet pattern in video |
| Polish / symmetry | Very Good–Excellent is a sensible preference | Finish grades equal light performance | Inspect actual face-up pattern |
| Video | Essential for final choice | A still image is enough | Watch for windowing, persistent dead zones and visible inclusions |
Why good numbers can still produce the weaker diamond
Candidate A: textbook numbers, weak face-up result
1.02 ratio · 66% depth · 61% table
The report looks comfortable, but the center stays see-through and a broad dark area does not break up as the stone turns. Reject it despite the numbers.
Candidate B: slightly outside the preferred band, better face-up result
1.06 ratio · 67% depth · 63% table
The outline is a touch elongated, but the pattern is balanced, the center stays lively and the millimeter spread is good. If you like the outline, this can be the better stone.
These are teaching examples, not actual inventory listings. The point is to show why proportions are screening tools rather than a cut grade.
Primary references & methodology
- GIA: How GIA Grades Diamonds — grading process, proportions, polish and symmetry.
- GIA: fancy-shape cut grading FAQ — explains that GIA does not currently assign an overall cut grade to fancy shapes.
- AsscherDiamond.com research methodology — how we distinguish laboratory facts, screening ranges and editorial observations.
Screening ranges on this page are editorial starting points, not an official overall Asscher cut grade. See the Research Center for methodology and source context. Research methodology →
Related Asscher guides
Asscher Depth Guide
See how depth affects spread and appearance.
Asscher Table Percentage
Understand the top facet and visual balance.
Windmill Pattern
Learn what a coherent Asscher facet pattern looks like.
Use L/W ~1.00–1.05, VS2+, G–H as your first filters—then confirm pattern on video.